We use cookies and similar technologies to process personal information for the operation of our website, statistical analysis, and providing targeted advertising. We share information about your use of the site with our advertising partners who may further share it with additional parties. You may opt out of performance cookies here, and learn more about how we use cookies here”
Search history
Clear

- Topics
- Release Information
- X-Sign Quick guide
-
X-sign User manual
- Account (4)
- License (4)
-
Manager (15)
- Pairing the device with X-Sign Manager
- Creating the channel
- Scheduling the content by channel
- Scheduling the content by device
- Editing the device management structure
- Pushing Real-Time Message to your BenQ Smart Signage remotely
- Controlling the device remotely
- Updating device Player remotely
- Managing the calling system
- Creating an API table in X-Sign Manager
- Setting Verification
- Getting the system notification
- Updating device status immediately New
- Player report (proof-of-play) New
- Using Designer Express New
-
Designer (18)
- Creating a new project file in X-Sign Designer
- Uploading your content from Designer
- Creating content in X-Sign Designer
- Creating content from Designed Templates
- Creating a clock widget in X-Sign Designer
- Setting a weather widget
- Creating an Image or Video slideshow
- Rotating an image or video
- Generating a QR Code
- Adding a data connection
- Setting a timer widget
- Creating an API template using the demo kit
- Creating a TV Input source widget in X-Sign Designer
- Setting background music in X-Sign Designer
- Changing the playing order of pages
- Sealing a file in X-Sign Designer
- Opening an X-Sign 1.x project file
- Changing your language in X-Sign Designer
- Player (6)
- Local Delivery (3)
- Report (2)
- Video Wall (3)
- Interactive (Premium) (6)
- API (Premium) (1)
- GPL/LGPL Software Licenses Used by X-Sign
- X-Sign OpenAPI
X-Sign User Manual
In this section, we'll explain how to manage content in X-Sign, control the player, and set up playlists.
X-sign 2.0 / X-sign User manual / Interactive (Premium)
Viewing an Interactive Report
2020 / 08 / 25
Once you have enabled interactive statistics for an interactive project, you can view the data for your statistics in X-Sign Manager. The following is an introduction to viewing and reviewing interactive reports.
To review the interactive statistics for an interactive project:
1. Log in to your X-Sign Manager account. Go to Report Analysis > Touch Usage Report (Beta).
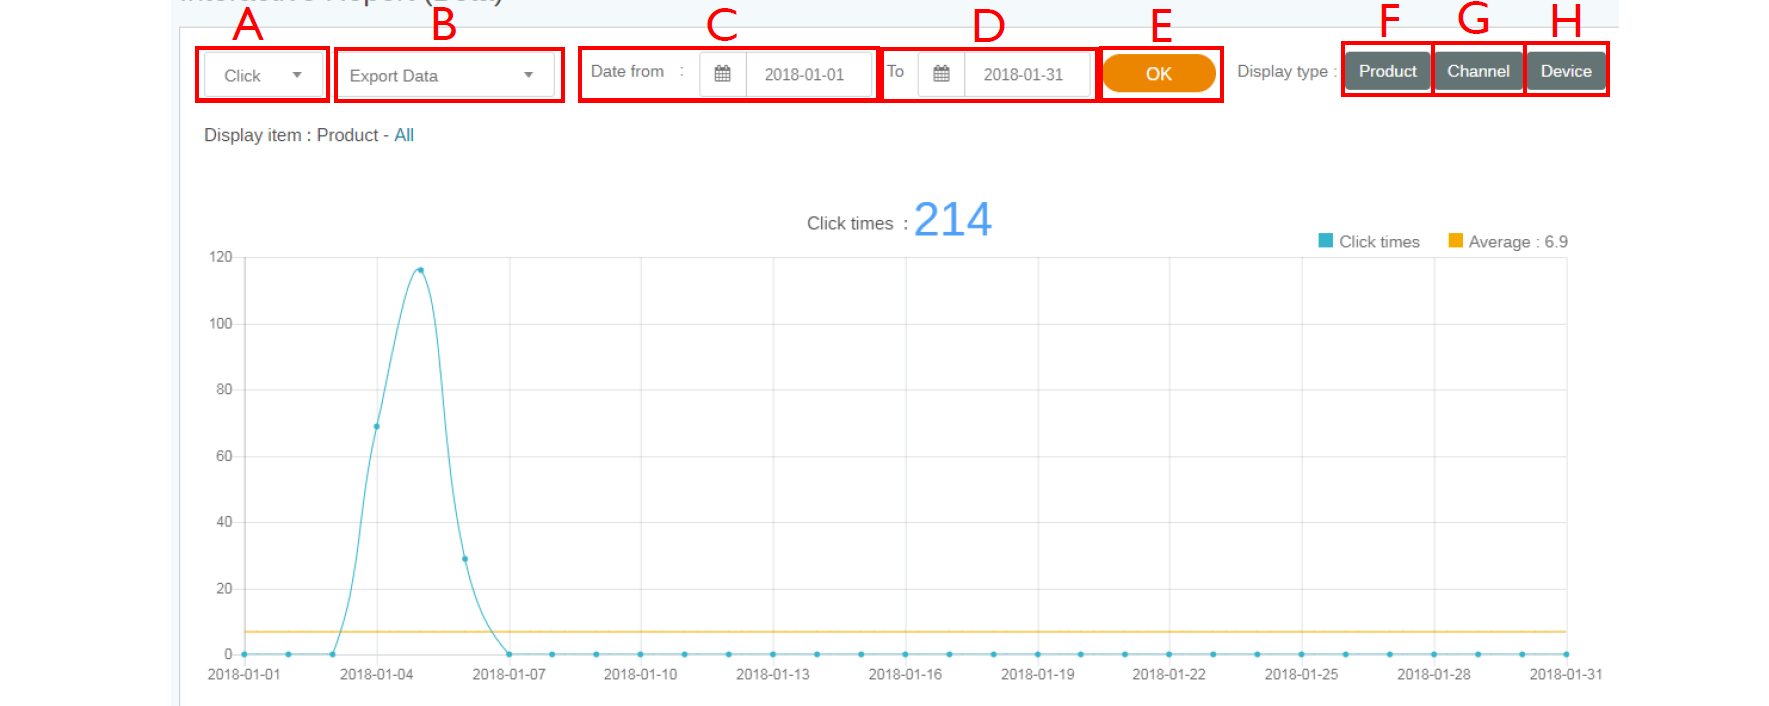
2. In the Touch Usage Report (Beta) page you can review statistics using the following items.

A. Type of Report – Click the icon to choose one of the following data sets to display: Click, Product, Channel, Category, or Device.
B. Export Data – Click the icon to choose an export setting from the dropdown list. You can select All Data (CSV) to export all interactive data to a csv-file format, or you can select Data in this page (PDF) to export the data displayed on the page to a PDF.
C. Date Form – Choose the start date for the data you want to display in your report.
D. To – Choose the end date for the data you want to display in your report.
E. OK – Select OK to confirm the selections and generate the report in the window below.
F. Product – Select Product to choose the data for specific products (i.e. - categories) you would like to display in your report.
G. Channel – Select Channel to choose the data for specific channel(s) you would like to display in your report.
H. Device – Select Device to choose the data for specific device(s) you would like to display in your report.
Your Local Office
BenQ America Corp.
5741 Legacy Dr #210, Plano, TX 75024, USA
Tel: 888-818-5888
Fax: +1-214-473-9998
Follow Us
Ⓒ2020 BenQ - all rights reserved.
TOP