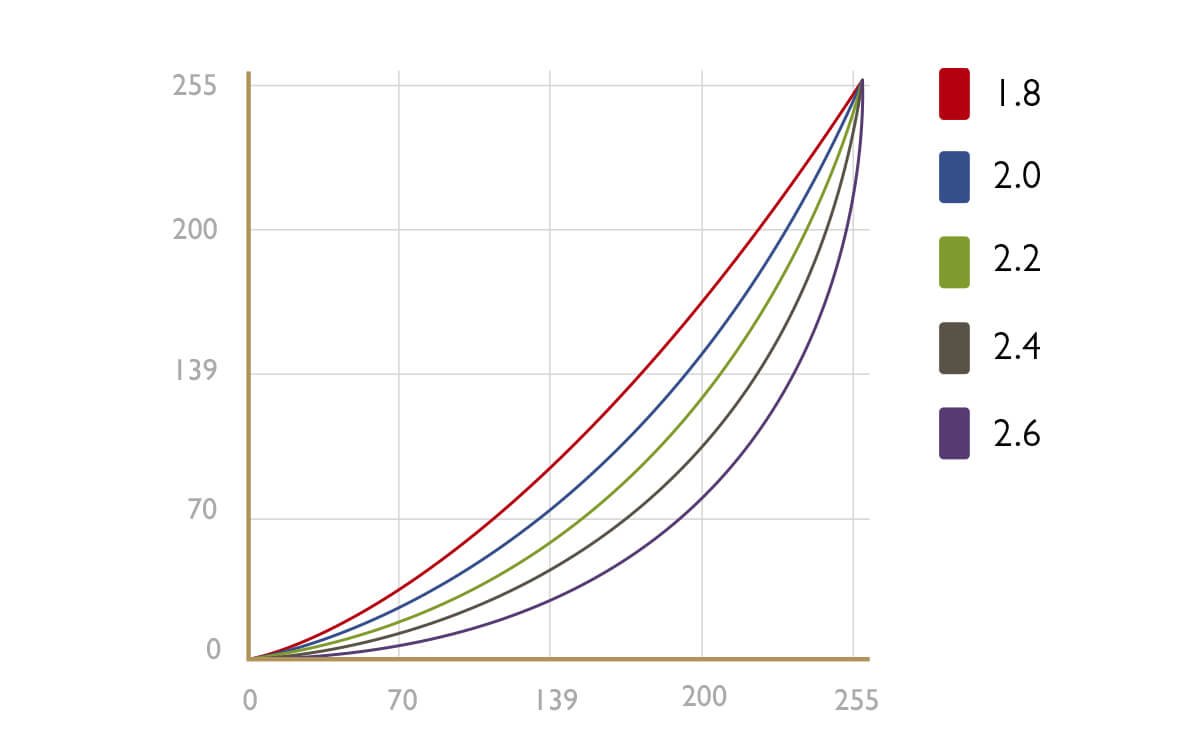

Gamma can be described as how smoothly black transitions to white on a digital display. It is often associated with a number like 2.2 or 2.4. This number represents the extent of the curve from black to white, or from white to black. Some typical gamma curves are shown in Figure 1, and the equation of obtaining the gamma curve value is shown in Equation 1.

Figure 1: Different Gamma Values and Its Associated Curves

Equation 1: Gamma Curve Value
You may have heard that gamma 2.2 is standard and wondered why. There is a power law relationship between the output luminance and the input voltage or digital value. Impact on luminance impacts the visual system, but the effects are not identical. Let’s take a look at Figure 2. The bottom row represents the intensity increasing from black to white in a linear fashion. The top row, visual encoding, represents the increased intensity from black to white in a low power fashion. Note that between 0.0 and 0.1, there is a big visual gap in linear intensity, with a smaller visual gap between 0.0 and 0.1 in visual encoding. And from 0.9 to 1.0 in linear intensity, the difference is subtle, whereas it is more obvious in visual encoding. Looking at the overall grays in visual encoding row, the perceived differences between each gray patch are almost identical. This phenomenon was also found in Ebner and Fairchild’s study in 1998, where they found using an exponent of 0.43 to convert linear intensity into lightness for neutrals can provide an optimal perceptual encoding of grays. The exponent of 0.43 is approximately 2.33, quite close to gamma 2.2. Hence, gamma value of 2.2 has become the golden standard of digital display for a proper calibration.

Figure 2: Visual Differences in Visual Encoding and Linear Intensity
So how does gamma curve impact overall image quality or perception? Gamma 2.2 delivers a balanced or ‘neutral’ tone between highlights and shadows so you can distinguish the grays easily in between. Gamma 1.0 is an interesting curve to look at. This is a 45-degree straight line relationship between the input signal and output luminance. This is also a ‘by-pass’ scenario where no processing is done on the display end. So you will see a very bright and ‘flat’ image, where almost no contrast is present, such as Figure 3.


Figure 3: Images of Gamma 1.0 (on the left) comparing to Gamma 2.2 (on the right)
Gamma 1.8 was popular due to Mac OS. Gamma 1.8 curve produces slightly brighter images than gamma 2.2 curve so sometimes it is preferred. However, since Mac OSX 10.6, gamma 2.2 has become the standard gamma curve for Mac OS as well. An example of gamma 1.8 versus gamma 2.2 is illustrated in Figure 4.


Figure 4: Images of Gamma 1.8 (on the left) comparing to Gamma 2.2 (on the right)
Gamma 2.4 is widely used in movie and TV industries due to Rec. 709 standards. The slightly enhanced contrast brings out the saturation of the colors for better viewing experiences. Of note, overall brightness of images may be lowered. An example of gamma 2.4 versus gamma 2.2 is illustrated in Figure 5.


Figure 5: Images of Gamma 2.4 (on the left) comparing to Gamma 2.2 (on the right)
Gamma 2.6 has gained popularity because of the latest DCI-P3 standard. DCI-P3 is endorsed by most newer digital movie theaters. With a gamma 2.6 curve, the images definitely look darker but also very saturated. And this is the effect that is required by the director, hence, DCI-P3 required gamma 2.6 curve. An example of gamma 2.6 versus gamma 2.2 is illustrated in Figure 6.


Figure 6: Images of Gamma 2.6 (on the left) comparing to Gamma 2.2 (on the right)
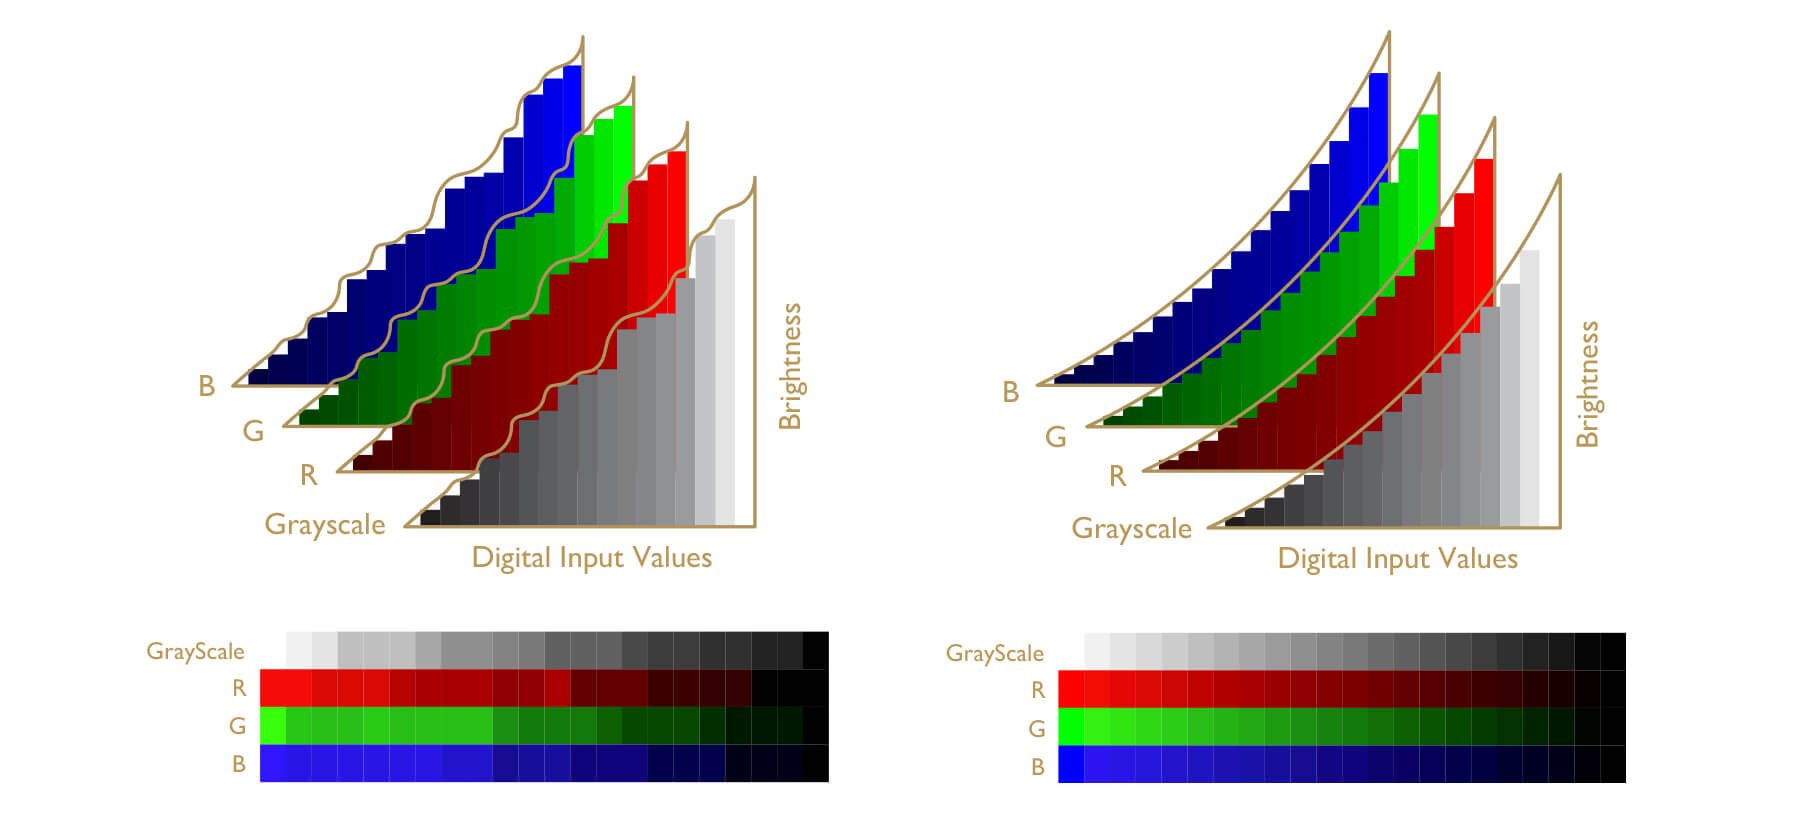
If a gamma curve is not smooth, the transition from black to white is not in even increments, as shown in Figure 7. Grays are harder to distinguish and color and contrast suffer. It follows that image quality and viewing experience are negatively impacted.

Figure 7: Uneven gamma curve can result in artifacts in perceptual grayscale and RGB ramps (on the left). No artifact presents in perceptual grayscale and RGB ramps in smooth gamma curve (on the right).

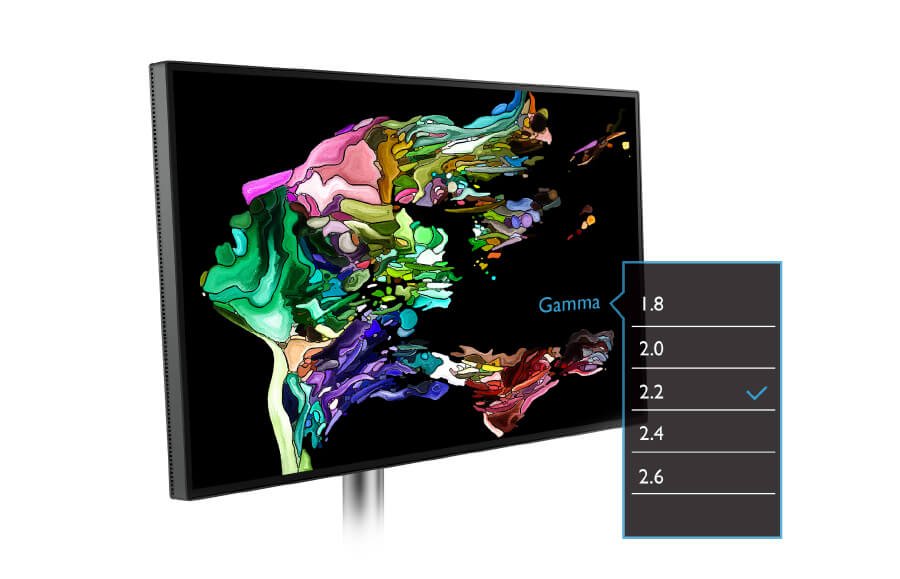
Figure 8: Select Preferred Gamma on Monitor OSD

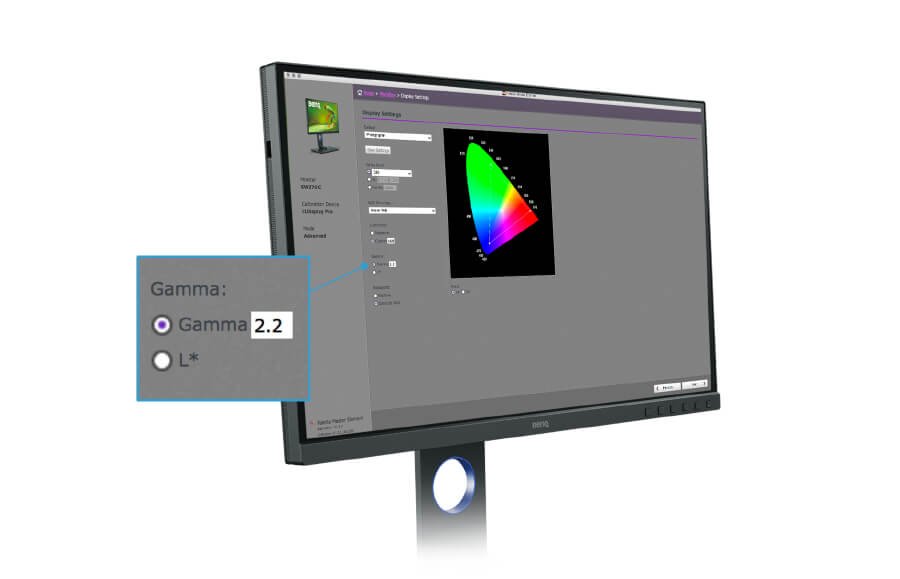
Figure 9: Select preferred Gamma with
BenQ Palette Master Element Software
Usually there are two ways to adjust gamma settings. The first way is straightforward--just look for the OSD (on screen display) on your monitor. A professional color management monitor, such as BenQ SW series monitor or PD series monitor, should have a Custom Mode in the Color Mode option. In Custom Mode, you can select different settings, such as color gamuts or gamma curves. Under the Gamma option, select factory calibrated gamma curves, ranging from 1.6 to 2.6 with 0.2 intervals.
Another way of adjusting gamma curve in SW series monitors is with BenQ proprietary calibration software, Palette Master Element. Connecting with an external calibrator, such as X-rite i1 Display Pro /Calibrite ColorChecker Display Pro, i1 Pro 2 or a Datacolor Spyder 5, you can simply select the gamma curve you would like in the Advanced mode. After calibrating, your gamma curve is ready for you to use in Calibration 1, 2, or 3. It's as simple as that. This is the preferred method to adjust your gamma curve if you have a BenQ SW series monitor.
We have talked about the definition of gamma curve and its important link to visual response. We also looked at how gamma curve can affect the image quality or perception, and some typical gamma values and their applications. Lastly, we learned the importance of maintaining a smooth gamma curve and how to select different gamma curves on BenQ SW/PD monitors. With Palette Master Element software and an external calibrator, you can also calibrate your gamma curve on your SW monitor.